Electronic Shelf Labels (ESLs) are transforming how retailers manage pricing. The installation process determines whether a store gains a competitive edge or inherits an expensive maintenance burden.
System Architecture Fundamentals
An ESL system consists of four interdependent components. Understanding their relationships prevents costly errors that teams make repeatedly.
Electronic Labels employ electrophoretic display technology. Microcapsules containing charged black and white particles migrate under applied voltage, creating stable images that persist without power. This physics enables battery life spanning 3-5 years under normal operating conditions-Hanshow's Nebular series consistently hits the 5-year mark, while some budget Chinese manufacturers barely make it to 2.5 years. Display sizes range from 1.54 inches for standard shelf edges to 12.2 inches for end-cap promotions.


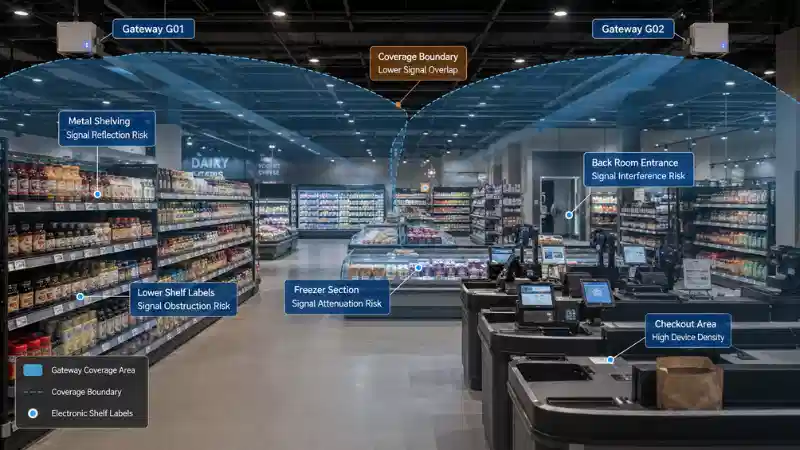
Base Stations (Access Points) bridge the network infrastructure and wireless label communication. SES-imagotag's VUSION system operates at 2.4GHz, while Pricer uses a proprietary infrared/RF hybrid in some models. Each base station manages hundreds to thousands of labels within its coverage radius-SES-imagotag claims 15,000 per access point, but the realistic number is 2,000-3,000 in a dense retail environment before unacceptable drop rates begin appearing.
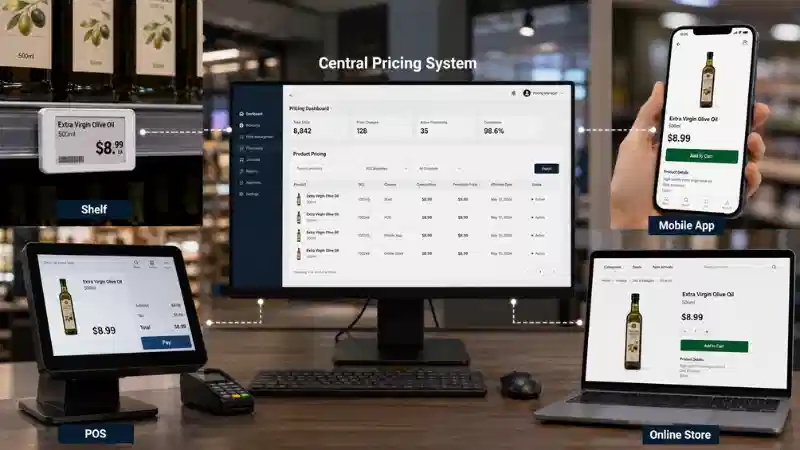
The Management Server executes the ESL software stack. It maintains the product database, renders display templates, queues update commands, and logs system events. Cloud deployments have improved significantly in the last three years. For most retailers under 10,000 labels, cloud is now the default recommendation.
Management Software provides the control interface for label registration, template design, content scheduling, and system monitoring. The API quality varies wildly between vendors. Pricer's API documentation is excellent. SES-imagotag's has improved but still has gaps. Some of the smaller vendors have APIs that feel like afterthoughts.

Site Survey: The Foundation of Successful Installation
According to a 2022 study by the Retail Industry Leaders Association, inadequate site surveys contribute to approximately 60% of ESL deployment failures requiring significant rework.
A rigorous survey requires three hours minimum for a 2,000-square-meter store.
Physical Environment Assessment
Floor Plan Documentation
Obtain or create detailed floor plans showing shelf positions, orientations, heights, and construction materials. Required information includes refrigeration unit locations and types, structural columns and walls, ceiling height variations, and existing electrical and network infrastructure.
Floor plans provided by the store should be verified. One Kroger installation in Ohio had a provided floor plan that was four years old and did not show a complete refrigeration section renovation. Base station positions required replanning on day two of installation. That situation is avoidable with proper verification.

Shelf Classification
Every shelving type behaves differently for RF signals, and understanding what exists in the store is essential before ordering mounting hardware.
Standard metal gondolas-the bread and butter of most retail stores-cause moderate signal attenuation. Rail clips work well here; Pricer's K-series clips and SES-imagotag's SmartTAG clips have shown consistent success. Wire basket shelving is actually easier to work with since the open design creates minimal RF interference. Hook adapters are effective, though vibration issues can occur in high-traffic produce areas where customers are constantly grabbing items.
Glass display cases are straightforward-low attenuation, and either adhesive or magnetic mounting works. 3M VHB tape is preferred for permanent installations because it does not shift over time. Refrigerated cases with closed doors-this is the configuration that causes project failures. Severe attenuation occurs through the glass and metal framing. External magnetic mount only. Internal placement should not be attempted regardless of vendor assurances. Drop rates are always unacceptable with internal placement.
Freezer units are even worse. Internal placement is not recommended. Period. Experimentation with range extenders, specialty antennas, and repositioning has not produced reliable results. Mount externally or do not mount at all.
RF Environment Analysis
Document all 2.4GHz emitters. WiFi access points are obvious-record channel assignments. But do not forget Bluetooth beacons (increasingly common for customer analytics), wireless security cameras, microwave ovens in break rooms, and IoT sensors.
Some LED lighting systems-particularly the smart/connected ones-generate enough 2.4GHz noise to cause intermittent refresh failures. One Target store installation required two days of troubleshooting before the correlation with their new lighting control system was identified. Check everything.

The textbook approach involves path loss calculations with formulas like PL(d) = PL(d₀) + 10n log₁₀(d/d₀) + Xσ. In practice, rough rules of thumb are learned and then validated with testing. Metal gondolas cut range to maybe 12-15 meters per base station. Near refrigeration, cut that in half. Behind concrete pillars, line-of-sight or a dedicated base station is needed. The walk test-covered later-is what actually tells whether coverage works.
Label Quantity Planning
Count SKUs per linear meter of shelf space for each department. Grocery typically runs 8-12 SKUs per meter. Health and beauty is all over the place-standard drugstore shelving might be 15-20, but a Sephora-style display can hit 40+. Electronics runs sparse at 3-6 per meter. Apparel similar at 4-8.
Multiply by total shelf length per department. Add 5% contingency for new product introductions-or 10% if the retailer does frequent planogram changes.
For size distribution, most deployments end up around 60-70% small labels (1.54"), 15-20% medium (2.13"), and the remainder split between 2.9" and larger sizes. Retailers consistently underorder the 2.9" size initially, then come back for more. Promotional displays drive margin, and store managers want bigger labels for those spots. Budget accordingly.
Network Infrastructure
Base Station Quantity
Theoretical coverage in free space is 25-30 meters. That number is useless in a real store. With metal shelving the realistic range is 10-15 meters. Refrigeration zones drop to 5-8 meters.
The actual calculation is not complicated. Divide the floor into zones by obstruction type, apply the realistic coverage radius for each zone, sum up the base stations needed, then add 20% redundancy. That redundancy is what keeps refresh success rate above 99% and prevents midnight emergency calls when a base station dies.
A 2,000 square meter grocery store broke down like this: the standard shopping area took about 1,400 square meters and needed 4 base stations. The refrigeration section at 400 square meters required 3 base stations because of the reduced range. A small high-density cosmetics area needed its own base station. Total came to 8, and with redundancy the order was for 10.
The vendor-SES-imagotag in this case-quoted 6. They were not wrong from a pure coverage standpoint. But 6 base stations would have delivered maybe 97% refresh rates. The 10-unit deployment consistently hits 99.5%+. That 2.5% difference translates to 75 labels not updating for the weekend sale in a 3,000-label store. The extra hardware cost is justified.
Placement
Mount between 3.0-4.0 meters above floor level. Lower than that and shelf obstructions kill coverage. Higher and signal strength to bottom-shelf labels is lost-which are often high-velocity SKUs that need reliable updates.
Horizontally, position at aisle intersections where clear sight lines exist in multiple directions. Never mount directly above refrigeration units. The compressor interference alone will cause problems.
Deploy in a hexagonal grid pattern rather than square. Hexagonal cells give roughly 13% better area coverage with the same base station count. This has been measured across multiple deployments.

Switches and Cabling

PoE+ switches are required-802.3at with at least 25.5W per port. Use gigabit, not Fast Ethernet. The image data for larger labels will bottleneck on 100Mbps links. Get a managed switch for VLAN segmentation and QoS. Port count should be base station count plus 30% headroom for future expansion.
For cabling, Cat6 or 6A shielded, 90 meters maximum run per TIA-568, keep 30cm separation from power cables on parallel runs. Use conduit or cable tray, especially in stores where ceiling infrastructure is visible. None of this is ESL-specific-it is standard good network installation practice.
Base Station Installation
Required Tools and Materials
Power drill with hammer function, 8mm masonry bits (bring spares because ceiling concrete eats these), cable crimping tool, cable tester, laser distance meter, spirit level, torque screwdriver. For materials: vendor-supplied mounting brackets (do not substitute), expansion anchors, Cat6 patch cables in various lengths, UV-resistant cable ties, and cable labels.

The cable labels are not optional.
Installation Procedure
Transfer base station coordinates from planning to physical locations using the laser distance meter. Mark mounting holes. Take photos at this stage-when the client asks why a base station is in a particular location six months later, documentation saves arguments.
Drill holes, insert anchors, secure brackets, verify level, torque to spec (typically 2-3 Nm for M6 into anchors). Route network cable from PoE switch to each position, leaving 1-meter service loops at each end. Secure cables at 1-meter intervals and label both ends.
Test every cable run before mounting the base station. Terminate with RJ45 following T568B standard, then test for continuity and pin assignment. Document results.
Once cables are verified, connect to base station, mount to bracket, verify the power LED lights up indicating successful PoE negotiation. Record the MAC address and physical location. The unit should appear in management software within 60 seconds. If it does not, check the cable termination first-90% of the time that is the problem, not a defective unit.
Label Installation
Pre-Installation Preparation
Labels ship in deep sleep mode. Activation varies by manufacturer and this has caused more wasted time than almost any other issue. SES-imagotag uses a button press-hold the recessed button 3-5 seconds until the LED flashes. Pricer labels auto-wake when they detect a valid base station signal. Hanshow mostly uses battery tab removal. Solum requires a magnetic activation pass over a designated sensor area.
The activation method should be known before installation day. Teams have wasted hours because nobody bothered to read the activation procedure in advance.
Batch registration is worth the setup time. Export serial numbers from shipping documentation, import into management software, pre-assign to location codes. This cuts per-label installation time by about 40%. SES-imagotag's bulk import works smoothly. Hanshow's requires specific CSV formatting that is not well documented-call their support for templates if the standard import throws errors.
Binding Methods
For planned deployments with pre-assigned positions, sequential binding works well. Technician goes to the designated position, scans label barcode, system confirms the pre-assigned binding, technician mounts, system queues update. Experienced installers hit 80-100 labels per hour this way.
Real-time binding makes sense when planograms are not finalized. Scan product barcode on shelf, scan label barcode, system creates binding on the fly. Slower at 50-70 labels per hour, but sometimes necessary.
Bulk binding via CSV upload is fastest when clean data is available. Validate thoroughly before upload.
Physical Mounting
Most retail shelving uses C-channel or T-channel rails at shelf edges. The common profiles are DBR 39 (39mm height, typical in European hypermarkets like Carrefour), HL 30 (30mm, common in North American grocery), and various Data Strip widths in warehouse retail. Match the clip to the profile, insert tabs into rail opening, apply downward pressure while sliding forward, release. Spring tension locks it in place. Verify the label resists horizontal sliding-customers will bump these constantly.
For metal surfaces without rails, or external mounting on refrigerated cases, magnetic mounts work through glass up to about 6mm thickness. This is how closed refrigerated cases get handled. Clean the surface with isopropyl alcohol first.
Adhesive mounting on glass, plastic, or wood is essentially permanent. 3M VHB tape creates industrial-strength bonds. Removal requires a heat gun and adhesive solvent, and surface damage is likely. Make sure the client understands this before using adhesive.
Installation Sequence
Complete all labels in one base station's coverage zone before moving to the next. This allows immediate verification and prevents installers from creating RF shadows that block updates to already-installed labels.
Priority order: end caps and promotional displays first (highest visibility, store management watches these), perimeter departments second (longest cable runs, catch infrastructure problems early), center store gondolas third (highest density, most repetitive), specialty areas last (save the tricky refrigeration work for when the team has rhythm).
For deployments over 3,000 labels, team structure matters. One supervisor managing workflow and handling store management communication. Two people on scanning/binding with mobile devices. Four installers doing physical mounting. One verifier confirming display accuracy and documenting issues. This configuration sustains 400-500 labels per hour. Experienced teams can hit 600+, but do not budget assuming that pace.

System Configuration
Update Intervals
This is the battery life versus responsiveness trade-off.
Setting everything to update every few minutes sounds great until labels are being replaced after 18 months instead of 4 years. A label updated every 5 minutes depletes roughly 8 times faster than one on a 2-hour cycle. One grocery chain set their entire produce department to 5-minute updates because prices changed frequently, then had to replace 400 labels two years later.
The sensible approach: use 1-2 hour intervals as default for most items. Move to 15-30 minute updates for categories with frequent price changes like produce or competitive grocery items. Reserve the aggressive 1-5 minute setting for specific SKUs during specific promotions, not as a blanket policy.
Channel Selection
The 2.4GHz band has 14 channels, but only 1, 6, and 11 are non-overlapping in FCC regions. Survey the existing WiFi deployment and pick ESL channels to minimize overlap. If WiFi is on channels 1 and 6, put ESL on 11. Most enterprise WiFi systems can be adjusted-coordinate with the client's IT team rather than just working around them.
Start transmission power at medium (10-15 dBm). Increase only if coverage gaps persist after positioning optimization. Going higher increases interference with other 2.4GHz systems including the store's own WiFi.
Template Design
Price needs to be the largest element-minimum 48-point font for readability at 1 meter distance. Product name secondary. Barcode sized for reliable scanning, minimum 80% magnification for EAN-13. Unit pricing is legally required in the EU and many US states, so verify local requirements. Promotional flags need contrasting colors on three-color displays; note that red renders as gray on monochrome labels, so design accordingly.

Integration
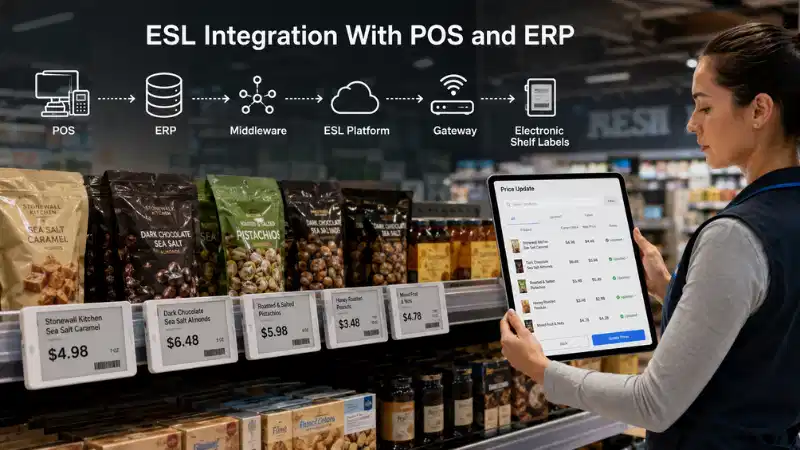
Two ways to connect to the business systems. Push model has the ERP or POS send price updates via API when changes occur-real-time sync but requires modifying the source system. Pull model has the ESL server query on a schedule-simpler to implement but introduces lag between price change and label update.
For grocery and electronics where prices change frequently, push is worth the integration effort. For stable pricing environments like hardware stores, pull works fine.
Direct database connection is also an option-query the product table for records modified since last sync. Always connect to a replica, not production. A poorly written ESL query brought down a POS system during Black Friday at one installation.
The actual API calls and database queries are straightforward REST posts and SQL selects. The challenge is data quality and error handling, not the technical integration itself.
Testing and Validation
Walk Test

Place test labels throughout the store, including positions at coverage boundaries-end of aisles, corners, behind pillars, near and inside refrigeration zones. Trigger simultaneous update to all test labels. Any label failing to update within 5 minutes indicates a coverage gap. Fix these before proceeding.
For more detailed analysis, use RF survey tools or the ESL system's built-in diagnostics to map signal strength. Acceptable RSSI is -70 dBm or stronger. Between -70 and -80 dBm is marginal-it will work but expect occasional failures. Weaker than -80 dBm is unacceptable. SES-imagotag shows per-label RSSI in their diagnostics. Hanshow requires a separate survey tool.
Functional Testing
Run a full-store refresh. Target metrics: 99% success on first attempt, 99.9% after automatic retry, completion under 15 minutes for stores under 5,000 labels. If these numbers are not being hit, there is a coverage problem, interference problem, or defective hardware. Do not sign off until thresholds are met.
Pull a 5% random sample and verify displayed prices match the source system. Zero tolerance for discrepancies. Any mismatch indicates binding error or integration failure.
For stress testing, simulate a flash sale by updating 50% of labels simultaneously. Verify the system stays responsive and the queue processes cleanly. Also test failover-disconnect one base station during an active update cycle and confirm affected labels pick up coverage from adjacent units. This validates that the 20% redundancy actually works.
When Things Go Wrong
These issues come up repeatedly.
Labels not responding: if the LED never flashes, the battery was not activated-redo the activation sequence. LED flashes but no display change means the label is probably out of range. Partial or garbled display updates point to RF interference-try different channels and hunt for competing 2.4GHz sources. Old content that will not update is almost always a binding problem in the management software.
Base station issues: no power LED means PoE is not negotiating-verify the switch port actually supports PoE+ and check cable termination. Power but no software registration is network configuration-IP assignment, firewall rules, VLAN settings. Intermittent failures in one zone suggest borderline coverage from that base station. All labels in a zone failing simultaneously usually means the base station itself died.
System-level problems: updates queuing but not reaching labels indicates communication breakdown between server and base stations-check network path and restart ESL services. Wrong prices despite correct source data means integration sync is broken-dig into API logs. Slow response points to database performance, especially on larger deployments. Disappearing bindings suggest data corruption-restore from backup immediately.
Keeping It Running
No universal maintenance program exists, but ignoring certain things causes problems.
Daily monitoring should be automated through system alerts for offline labels, low battery, and failed updates. Weekly, review label status reports and investigate anything offline more than a day. Monthly, physically inspect labels in dusty areas-bakery departments are notorious-and spot-check accuracy. Annually, review whether store layout changes have affected base station coverage and plan battery replacements.
On batteries: labels are not user-serviceable, so the whole unit gets replaced when battery depletes. Do not wait for failures. When 10% of the fleet shows low battery warnings, place the replacement order. Emergency orders cost more and dead labels during promotions create problems.
Deployment Scale
Small deployments under 500 labels need 1-2 base stations, a day of installation with two people, and cloud hosting. Good starter projects for teams new to ESL.
Medium deployments from 500 to 3,000 labels require 3-8 base stations, 2-4 days with a 4-6 person team, and actual project planning.
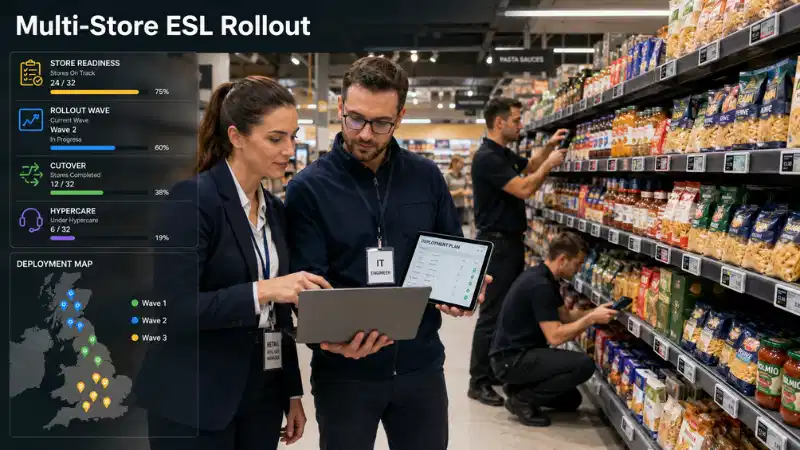
Large format stores with 3,000-15,000 labels are different. Plan for 8-25 base stations, 1-2 weeks, teams of 8-12, and on-premise servers for reliability. Phased deployment and dedicated project management become necessary.
Enterprise scale above 15,000 labels-flagships, large supermarkets-means 25+ base stations, 2-4 weeks, 15+ person teams with specialized roles, and redundant infrastructure. Get experienced help for a first deployment at this scale.
Quality Assurance Checklist
Before starting: site survey completed with photos, RF interference mapped, base station positions marked, network infrastructure verified, label quantities confirmed with contingency, team briefed, store management informed.
During installation: base stations at correct height, cables tested before termination, each base station confirmed online before moving to next, activations verified, bindings validated, zone refresh tests passing 99%+, coverage gaps addressed.
After completion: full store refresh under 15 minutes, 99.9% success rate achieved, price accuracy audit passed, integration verified, staff trained, documentation delivered, support contacts confirmed, maintenance schedule established.